


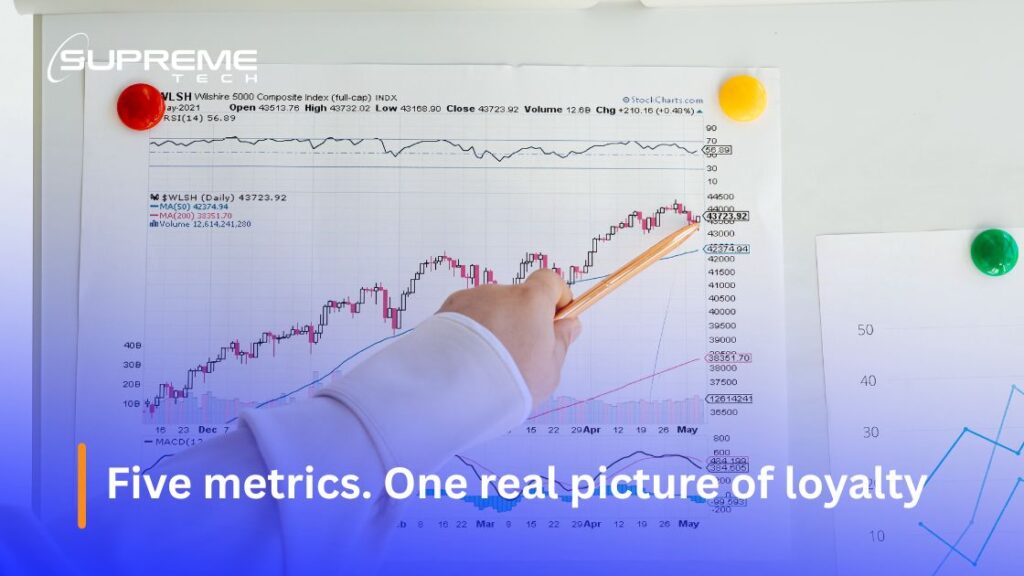
Customer Loyalty Analytics: 5 Metrics Retail Brands Should Track Beyond Repeat Purchases
03/06/2026
464
Most retail brands know their repeat purchase rate. Far fewer know which of those repeat customers are actually loyal and which are one competitor promotion away from leaving for good.
That distinction is where customer loyalty analytics earns its place. Done well, it is the difference between a loyalty dashboard that confirms what you already know and one that tells you what is about to happen before it does. The stakes are significant. According to Gartner’s 2024 CMO Spend Survey, most loyalty teams still measure program health using metrics that overvalue program contribution and miss the incremental revenue story entirely. And Forrester found that while consumer usage of loyalty programs is growing, brands are simultaneously struggling to convert that usage into genuine emotional loyalty, meaning the data they are tracking is not closing the gap.
Think about what this looks like in practice. A fashion retailer sees strong repeat purchase numbers and reports a healthy loyalty program. But underneath those numbers, a segment of high-value customers has quietly started shopping less frequently, spending smaller amounts per visit, and opening fewer brand emails. The repeat purchase rate does not show any of this. By the time it does, those customers will already be someone else’s regulars.
This article walks through the five metrics that give retail brands a materially more accurate picture of loyalty health, with benchmarks, diagnostic logic, and real brand examples for each one.
What Customer Loyalty Analytics Actually Measures
Customer loyalty analytics is not a single report or a dashboard metric. It is a measurement discipline that tracks the full spectrum of signals indicating how committed a customer actually is to a brand: behavioral, emotional, relational, and financial. It uses those signals to make forward-looking retention decisions, not backward-looking performance reviews.
The distinction from standard loyalty reporting is significant. Standard loyalty reporting answers the question: “What did our customers do last month?” Customer loyalty analytics answers: “Which customers are becoming more committed, which are drifting, and what should we do about each group right now?”
That shift from descriptive to predictive is what separates analytics-led loyalty programs from points-ledger programs. McKinsey research shows that companies applying CLV-based analytics to their customer management consistently generate higher return on marketing investment than those using spend-based segmentation alone. According to the Forrester Wave: Loyalty Platforms, Q4 2025, the leading loyalty platforms are now built around predictive analytics and real-time personalization, a signal that the industry has recognized that backward-looking metrics are no longer sufficient.
Key Concept: The Analytics Maturity Stack for Loyalty
Most retail loyalty programs sit at Level 1 or 2. The commercial advantage concentrates at Level 4.
Level 1: Descriptive. Tracks points, redemptions, visit frequency. Tells you what happened. No predictive value.
Level 2: Diagnostic. Adds cohort analysis and segmentation. Tells you which customers behaved differently. Still backward-looking.
Level 3: Predictive. Integrates multi-signal data to forecast churn risk, CLV trajectory, and advocacy probability. Enables proactive intervention.
Level 4: Prescriptive. Uses AI and real-time data to automatically trigger the right engagement action for the right customer at the right moment. Closes the loop between insight and execution.
Why Repeat Purchase Rate Fails as a Loyalty Metric
Repeat purchase rate tells you how often customers are coming back. It tells you nothing about why they are coming back, how committed they are to continuing, or what it would take to make them leave. A customer making their fourth purchase this year could be emotionally loyal, habitually loyal, or simply locked into a subscription they have not gotten around to canceling. Repeat purchase rate treats all three identically.
This is not a theoretical concern. Gartner explicitly warns that loyalty teams frequently make measurement errors by grabbing simple statistics, ignoring costs, or focusing on the wrong metrics altogether. Deloitte’s 2025 Consumer Loyalty Program Survey of 5,564 loyalty program members found that while 72% say loyalty programs make them more likely to spend with a preferred brand, those numbers reflect members of their most-preferred brand’s program. The data looks considerably less compelling across the full member base.
Consider a grocery retailer that runs a weekly promotion and sees strong repeat visits during the promotional period. The repeat purchase rate looks healthy. But when the promotion ends, visit frequency drops sharply. What the retailer was measuring was price sensitivity, not loyalty. The two look identical in repeat purchase rate data. They look very different in the five metrics below.
Metric 1: Customer Lifetime Value Trajectory, The Directional Signal That Matters More Than the Number
Customer Lifetime Value (CLV) is not a new metric. Most retail brands calculate some version of it. The problem is that most calculate it as a static number, a point-in-time estimate of how much a customer is worth, rather than tracking it as a trajectory over time.
The trajectory is where the loyalty signal lives. A customer with a high absolute CLV who is declining is a very different strategic priority than a customer with a moderate CLV who is growing. The first is a defection risk. The second is an investment opportunity. Tracking CLV directionally, month-over-month or quarter-over-quarter, gives loyalty teams a lead indicator of loyalty health that repeat purchase rate simply cannot provide.
McKinsey recommends a three-step CLV approach for retail: collect behavioral and transactional data across multiple years, determine true customer value by accounting for returns, service costs, and margin, then target investment toward customers showing positive CLV trajectories. According to McKinsey research, omnichannel shoppers have 30% higher CLV than single-channel customers, and predictive CLV models outperform historical calculations by 25 to 40% in accuracy.
In practice, a beauty retailer can use CLV trajectory data to make a very specific decision: stop offering the same re-engagement discount to every lapsed customer, and instead focus spend on customers whose CLV was growing before they lapsed. Those customers are worth recovering. A customer whose CLV was already declining before they went quiet is a very different conversation.
What to measure: CLV per customer cohort, tracked quarterly. Flag any cohort showing a declining trajectory for three consecutive periods as a priority intervention group.
Benchmark: McKinsey research shows personalization programs, the primary mechanism for improving CLV trajectory, typically deliver 10 to 15% revenue increases, with best-in-class execution reaching 25%.
Metric 2: Net Promoter Score, The Advocacy Signal That Predicts Growth
NPS is one of the most debated metrics in customer experience and one of the most commercially validated when used correctly. The key word is “correctly.” NPS used as an annual survey score averaged across the entire customer base tells a brand very little. NPS tracked at the cohort level, connected to CLV data, and monitored for directional change over time is one of the strongest leading indicators of loyalty health available.
Bain and Company, the original developers of NPS, found that in most industries NPS explains roughly 20 to 60% of the variation in organic growth rates among competitors. On average, an industry’s NPS leader outgrows its competitors by more than two times. Sustained value creators have NPS scores two times higher than the average company.
The mistake most retail brands make with NPS is averaging it into meaninglessness. A brand with 40% promoters and 30% detractors has the same blended NPS as one with 30% promoters and 20% detractors but very different loyalty profiles. The detractor proportion is the more commercially urgent number. Bain and Company analysis shows that every detractor actively costs the brand through negative word of mouth and reduced spending, not merely through absence of advocacy.
In practice, a home appliance brand might notice that its NPS among customers who experienced a warranty claim is 25 points lower than its overall NPS. That gap reveals a specific operational failure in the post-purchase service experience, and it tells the loyalty team exactly where to intervene before those detractors start telling friends to shop elsewhere.
What to measure: NPS by customer cohort and purchase recency segment. Track the promoter-to-detractor ratio separately from the blended score. Flag any cohort where the detractor proportion rises by more than 5 percentage points quarter-over-quarter.
Benchmark: Bain and Company found that NPS leadership positions outgrew competitors by eight percentage points on median growth rates.
Metric 3: Share of Wallet, The Competitive Loyalty Signal Most Brands Do Not Track
Share of wallet is the percentage of a customer’s total category spend that goes to your brand. It is arguably the most direct measure of competitive loyalty, of how much a customer actually chooses you over alternatives when both are available.
Most retail brands do not track share of wallet because it is harder to measure than internal transaction data. You cannot directly observe what a customer spends at your competitors. But this difficulty is not a reason to ignore the metric. It is a reason to find proxies for it. Purchase frequency relative to category averages, cross-category penetration within a brand’s own portfolio, and declining basket size over time are all indicators of share of wallet movement.
The commercial logic is direct. A customer spending $500 a month in your product category but only $100 of that with you has a 20% share of wallet. Getting that to 30% doubles revenue from that customer without adding a single new customer to the database.
Brand Case Study: Tesco Clubcard
Tesco’s Clubcard is one of the clearest examples of share of wallet analytics applied at scale. When Tesco launched Clubcard in 1995, the program was designed explicitly around growing share of household grocery spend, not just rewarding existing loyalty. By connecting purchase data across every category a household bought, Tesco could identify customers who spent heavily on certain categories in-store but clearly bought other categories elsewhere. Personalized offers and coupons were then directed specifically at those whitespace categories. The impact was immediate: within one month of launch, Tesco overtook Sainsbury’s in UK market share for the first time. In 2024, Tesco Clubcard reached 23 million of the UK’s 28.3 million households. Clubcard-linked transactions now account for 84% of UK Tesco sales, according to Tesco’s Preliminary Results FY2024/25. The program grew from a loyalty card into a share of wallet management system.
Logic Chain: Share of Wallet Diagnosis
IF a customer’s purchase frequency with your brand is stable or growing… BUT their average basket size is declining… THEN share of wallet may be contracting. The customer is spreading spend across more options. THEREFORE trigger a cross-category or personalized bundling offer before the behavioral pattern solidifies into a lower share of wallet baseline.
What to measure: Purchase frequency relative to category benchmarks; basket size trajectory; cross-category penetration rate within your own portfolio. For brands with first-party data partnerships, direct share of wallet estimates from panel data.
Benchmark:Gartner research found that customers who received personalized communications were 3.7 times more likely to purchase more than originally intended, a direct share of wallet lever.
Metric 4: Engagement Depth Score, The Emotional Loyalty Signal Hidden in Non-Purchase Data
Engagement Depth Score is a composite metric, not a single data point, that measures how actively a customer interacts with a brand across all non-purchase touchpoints. It is the most direct measurable proxy for emotional loyalty available within a brand’s own data.
The commercial reason it matters is that emotional disengagement precedes transactional churn by weeks or months. A customer whose purchase frequency holds steady but whose app usage, email open rates, content interaction, and social engagement have all declined is beginning to disengage emotionally before they disengage transactionally. Without an Engagement Depth Score, that customer is invisible in standard loyalty reporting until the day they stop buying.
Forrester research found that brands making customers feel appreciated see 87% of them advocate for the brand, 80% spend more, and 76% continue their business. These outcomes are measurable before purchase behavior reflects them. The engagement signals that predict these outcomes include app open frequency, email click-through rate, community or content platform participation, response to surveys, and customer service contact sentiment.
Brand Case Study: Tesco Clubcard Challenges
In May 2024, Tesco launched Clubcard Challenges, an AI-personalized engagement initiative that invited Clubcard members to complete personalized activity challenges over six-week periods to unlock extra points. The engagement design was deliberately built around non-purchase behaviors: completing challenges, engaging with the app, interacting with personalized offers. Tesco ran four campaigns in 2024, progressively scaling from a smaller test group to 10 million customers. The result was that Clubcard members collected over half a billion extra Clubcard points through Challenges, and Tesco reported its “biggest ever Christmas performance” in 2024 with Clubcard Challenges cited as a direct contributor. The initiative won the Best Global Loyalty Launch or Initiative at the 2025 International Loyalty Awards, according to Eagle Eye. The lesson: non-purchase engagement signals are not soft metrics. They are the early warning system for where revenue is about to go.
Building an Engagement Depth Score requires integrating data that most retail brands currently hold in separate systems. Marketing automation platforms hold email engagement data. Mobile teams hold app usage data. Customer service platforms hold contact sentiment data. Without a unified customer data layer, these signals cannot be combined into a single composite score per customer.
What to measure: A weighted composite of email click rate, app open frequency, content interaction rate, survey response rate, and community participation, scored per customer and tracked monthly. Flag any customer whose composite score falls by more than 25% in a single quarter.
Benchmark:Deloitte’s 2025 research found that 70% of emotionally engaged consumers spend twice as much with brands they are loyal to compared to those with low engagement.
Metric 5: Churn Probability Score, The Predictive Metric That Turns Analytics Into Action
Churn Probability Score is a model-generated risk rating assigned to individual customers based on behavioral signals that statistically precede defection. It is the metric that turns customer loyalty analytics from a reporting function into an operational one.
The evidence that churn is predictable from behavioral data is well established. McKinsey found that companies using predictive analytics for churn prevention can respond up to 80% faster to at-risk accounts. Gartner found that organizations implementing predictive analytics for customer retention see an average 15 to 25% reduction in churn rates.
The behavioral signals that consistently feed a Churn Probability Score include: purchase recency decline, reduction in average order value, channel contraction (moving from multi-channel to single-channel purchasing), declining Engagement Depth Score, and a drop in NPS segment. Any combination of three or more of these signals significantly elevates churn probability.
In practice, a retail subscription brand might find that customers who reduce their app usage by more than 40% in a 30-day period are three times more likely to cancel within the next 60 days. Without a Churn Probability Score surfacing that pattern, the brand’s customer success team is reviewing renewal lists manually and acting too late. With it, an automated re-engagement sequence can trigger at the moment the app usage dip is detected.
A Churn Probability Score is only as useful as the intervention protocol it triggers. Analytics without action is reporting. The score needs to connect to automated or semi-automated retention workflows, whether personalized outreach, recognition gestures, service check-ins, or exclusive offers, deployed at the customer level without requiring a manual review for every at-risk account.
What to measure: A machine learning model trained on historical churn data that produces a probability score from 0 to 100 per customer, updated weekly. Define intervention tiers, 60 to 75% as amber and 75% or above as red, and connect each tier to a distinct retention protocol.
Benchmark:Gartner found that customers who felt valued were 82% more likely to repurchase even when given the opportunity to switch.
How the Five Metrics Work Together: The Loyalty Analytics Dashboard
The five metrics are most powerful when read together, not in isolation. Each one answers a different question. Their intersection identifies the customers who require the most urgent attention and the most personalized response.
| Metric | Question It Answers | Predictive or Descriptive |
|---|---|---|
| CLV Trajectory | Is this customer becoming more or less valuable over time? | Predictive |
| Net Promoter Score | Is this customer likely to advocate for or against us? | Leading indicator |
| Share of Wallet | How much of this customer’s category spend do we actually capture? | Competitive diagnostic |
| Engagement Depth Score | Is this customer emotionally engaged or quietly disengaging? | Early warning |
| Churn Probability Score | How likely is this customer to defect in the next 90 days? | Predictive |
A customer showing a declining CLV trajectory, dropping NPS, contracting share of wallet, low Engagement Depth Score, and a rising Churn Probability Score is not a loyalty program member in any meaningful sense. They are an imminent defection that has not yet shown up in the purchase data. Most retail loyalty programs would not surface this customer at all. A customer loyalty analytics system built around these five metrics would flag them weeks in advance and trigger a response automatically.
Gartner explicitly recommends that loyalty leaders adopt multi-layer measurement to isolate incremental program revenue using advanced data analysis and predictive modeling. The five-metric framework above is the practical expression of that recommendation.
How SupremeTech Can Help
The five metrics in this article all depend on the same foundation: customer data that is unified, real-time, and connected across every channel the customer touches. Without that foundation, brands are not choosing between good analytics and great analytics. They are choosing between guesswork and informed guesswork.
This is where SupremeTech starts. For brands dealing with fragmented data across channels, SupremeTech’s omnichannel retail solutions practice designs the unified customer identity layer that connects in-store, e-commerce, mobile, and service data into a single customer record. That record is what makes CLV trajectory tracking, Engagement Depth Scoring, and Churn Probability modeling possible at the individual customer level.
For brands that have a data foundation but have not yet built the predictive analytics layer, SupremeTech’s AI-driven development team builds the models that close that gap: churn prediction, behavioral segment classification, dynamic reward personalization, and automated intervention triggers, designed as operational tools within the loyalty infrastructure rather than standalone analytics projects.
For brands building or scaling e-commerce channels, SupremeTech’s e-commerce development services ensure that every behavioral signal, from browse depth to category affinity to basket composition changes, is captured in a format the loyalty data models can use from day one.
Where standard platforms cannot support the specific data model combinations a brand needs, SupremeTech’s custom software development team builds the loyalty data layer that fits the brand’s actual system environment. And for brands scaling infrastructure to handle real-time data processing across multiple channels, SupremeTech’s cloud infrastructure and DevOps practice keeps the systems that loyalty depends on performing reliably under load.
Ready to move beyond repeat purchase rate? SupremeTech helps retail brands build the data infrastructure that turns customer loyalty analytics from a dashboard into a competitive advantage. Start a conversation with SupremeTech →
FAQs Section
Standard loyalty reporting describes what already happened: redemption rates, visit frequency, points balances. Customer loyalty analytics goes further by using multi-signal data to predict what is about to happen and prescribe what the brand should do about it. The practical difference is that analytics-led programs intervene before customers defect, while reporting-led programs detect defection after the fact.
A Churn Probability Score can be trained on 12 to 18 months of transaction and engagement data for the customer segments where churn rates are meaningful. CLV trajectory tracking requires at least two full purchase cycles per customer cohort. NPS can be integrated immediately with any existing survey infrastructure. The constraint for most brands is integration, not data volume. Most of the required data already exists in separate systems. The first step is connecting those systems, not collecting more data.
The ROI rests on three mechanisms: reduced churn translates directly to retained revenue; improved share of wallet increases revenue from the existing customer base without acquisition cost; and more precise retention investment means less budget spent on customers who would have stayed anyway.
Not all five at once, and that is fine. The right sequencing is to start with the metrics that require the least new data infrastructure. NPS can be activated immediately. CLV trajectory tracking uses transaction history most brands already have. Churn Probability Scoring and Engagement Depth Score require more integration work and are better tackled in a second phase. Share of wallet estimation can begin with internal proxies like basket size trajectory and category penetration before more sophisticated panel data is introduced. Phasing the implementation does not diminish the value. It makes the investment manageable.