Header image

Explore all articles in Knowledge

Knowledge

+0

    Create Your First AWS Lambda Function (Node.js, Python, and Go)

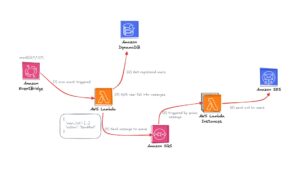
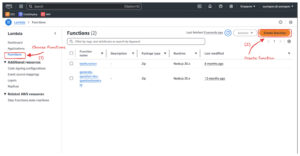
    Welcome back to the “Mastering AWS Lambda with Bao” series! In the previous episode, we explored the fundamentals of AWS Lambda, including its concept, how it works, its benefits, and its real-world applications. In this SupremeTech blog episode, we’ll dive deeper into the example we discussed earlier. We’ll create an AWS Lambda function triggered by AWS EventBridge, fetch data from AWS DynamoDB, batch it into manageable chunks, and send it to Amazon SQS for further processing. We’ll implement this example in Node.js, Python, and Go to provide a comprehensive perspective. If you’re unfamiliar with these AWS services, don’t worry! I’ll guide you through it, like creating sample data for DynamoDB step-by-step, so you’ll have everything you need to follow along. By the end of this episode, you’ll have a fully functional AWS Lambda workflow triggered by EventBridge, interacts with DynamoDB to retrieve data, and pushes it to SQS. This will give you a clear demonstration of the power of serverless architecture. Let’s get started! >>> Maybe you are interested: Best Practices for Optimizing AWS Lambda Functions Prerequisites Before diving into how to create an AWS lambda function, make sure you have the following: AWS Account: Ensure you have access to create and manage AWS resources.Programming Environment: Install the following based on your preferred language:Node.jsPythonGolangIAM Role for Lambda Execution: Create an IAM role with the following permissions:AWSLambdaBasicExecutionRoleAmazonDynamoDBReadOnlyAccessAmazonSQSFullAccess Setting Up AWS Services We’ll configure the necessary AWS services (EventBridge, DynamoDB, and SQS) and permissions (IAM Role) to support the Lambda function. Using AWS Management Console: Step 1: Create an IAM Role Navigate to IAM Console:Open the IAM Console from the AWS Management Console.Create a Role:Click Roles in the left-hand menu, then click Create Role. Under Trusted Entity Type, select AWS Service, and then choose Lambda. Click Next to attach permissions. Attach Policies:Add the following managed policies to the role:AWSLambdaBasicExecutionRole: Allows Lambda to write logs to CloudWatch.AmazonDynamoDBReadOnlyAccess: Grants read access to the DynamoDB table.AmazonSQSFullAccess: Allows full access to send messages to and read from SQS queues. Review and Create:Give the role a name (we’ll use LambdaExecutionRole).Review the permissions and click Create Role. Copy the Role ARN:Once the role is created, copy its ARN (Amazon Resource Name) when creating the Lambda function. Step 2: Create a DynamoDB Table This table will store user data for the example Navigate to DynamoDB and click Create Table. Set the table name to UsersTable.Use userId (String) as the partition key. Leave other settings as default and click Create. Step 3: Add data sample to UsersTable (DynamoDB) Click on Explore items on the left-hand menu, then click Create item. Input sample data to create items, then click Create item to submit (Create at least 10 items for better experience). Step 4: Create an Amazon SQS Queue Go to Amazon SQS and click Create Queue. Name the queue UserProcessedQueue. Leave the defaults and click Create Queue. Create the AWS Lambda Function Now, we’ll create a Lambda function in AWS to fetch data from DynamoDB, validate it, batch it, and push it to SQS. Examples are provided for Node.js, Python, and Go. Lambda Function Logic: Fetch all users with emailEnabled = true from DynamoDB.Validate user data (e.g., ensure email exists and is valid).Batch users into groups of 5.Send each batch to SQS. Node.js Implementation Init & Install dependencies (if needed) (Sample code): npm init npm install aws-sdk Create a file named index.js with the below code: const AWS = require('aws-sdk'); const dynamoDB = new AWS.DynamoDB.DocumentClient(); const sqs = new AWS.SQS(); const emailRegex = /^[^\s@]+@[^\s@]+\.[^\s@]+$/; exports.handler = async () => {   try {       // Fetch data from DynamoDB       let params = {           TableName: "UsersTable", // Replace with your DynamoDB table name           FilterExpression: "emailEnabled = :enabled",           ExpressionAttributeValues: { ":enabled": true }       };       let users = [];       let data;       do {           data = await dynamoDB.scan(params).promise();           users = users.concat(data.Items);           params.ExclusiveStartKey = data.LastEvaluatedKey;       } while (params.ExclusiveStartKey);       // Validate and batch data       const batches = [];       for (let i = 0; i < users.length; i += 100) {           const batch = users.slice(i, i + 100).filter(user => user.email && emailRegex.test(user.email)); // Validate email           if (batch.length > 0) {               batches.push(batch);           }       }       // Send batches to SQS       for (const batch of batches) {           const sqsParams = {               QueueUrl: "https://sqs.ap-southeast-1.amazonaws.com/account-id/UserProcessedQueue", // Replace with your SQS URL               MessageBody: JSON.stringify(batch)           };           await sqs.sendMessage(sqsParams).promise();       }       return { statusCode: 200, body: "Users batched and sent to SQS!" };   } catch (error) {       console.error(error);       return { statusCode: 500, body: "Error processing users." };   } }; Package the code into a zip file: zip -r function.zip . Python Implementation Init & Install dependencies (if needed) (Sample code): pip install boto3 -t . Create a file named index.js with the below code: import boto3 import json dynamodb = boto3.resource('dynamodb') table = dynamodb.Table('UsersTable') # Replace with your table name sqs = boto3.client('sqs') def lambda_handler(event, context):   try:       # Fetch data from DynamoDB       response = table.scan(           FilterExpression="emailEnabled = :enabled",           ExpressionAttributeValues={":enabled": True}       )       users = response['Items']       # Validate and batch data       batches = []       for i in range(0, len(users), 100):           batch = [user for user in users[i:i + 100] if 'email' in user]           if batch:               batches.append(batch)       # Send batches to SQS       for batch in batches:           sqs.send_message(               QueueUrl="https://sqs.ap-southeast-1.amazonaws.com/account-id/UserProcessedQueue", # Replace with your SQS URL               MessageBody=json.dumps(batch)           )       return {"statusCode": 200, "body": "Users batched and sent to SQS!"}   except Exception as e:       print(e)       return {"statusCode": 500, "body": "Error processing users."} Package the code into a zip file: zip -r function.zip . Go Implementation Init & Install dependencies (if needed) (Sample Code): go mod init setup-aws-lambda go get github.com/aws/aws-lambda-go/lambda go get github.com/aws/aws-sdk-go/aws go get github.com/aws/aws-sdk-go/aws/sessiongo get github.com/aws/aws-sdk-go/service/dynamodbgo get github.com/aws/aws-sdk-go/service/sqs Create a file named main.go with the code below: package main import ( "context" "encoding/json" "log" "github.com/aws/aws-lambda-go/lambda" "github.com/aws/aws-sdk-go/aws" "github.com/aws/aws-sdk-go/aws/session" "github.com/aws/aws-sdk-go/service/dynamodb" "github.com/aws/aws-sdk-go/service/dynamodb/dynamodbattribute" "github.com/aws/aws-sdk-go/service/sqs" ) type User struct { UserId string `json:"userId"` Email string `json:"email"` EmailEnabled bool `json:"emailEnabled"` } func handler(ctx context.Context) (string, error) { sess := session.Must(session.NewSession()) dynamo := dynamodb.New(sess) sqsSvc := sqs.New(sess) // Fetch users from DynamoDB params := &dynamodb.ScanInput{ TableName: aws.String("UsersTable"), // Replace with your DynamoDB table name FilterExpression: aws.String("emailEnabled = :enabled"), ExpressionAttributeValues: map[string]*dynamodb.AttributeValue{ ":enabled": {BOOL: aws.Bool(true)}, }, } var users []User err := dynamo.ScanPages(params, func(page *dynamodb.ScanOutput, lastPage bool) bool { for _, item := range page.Items { var user User err := dynamodbattribute.UnmarshalMap(item, &user) if err == nil && user.Email != "" { users = append(users, user) } } return !lastPage }) if err != nil { return "", err } // Batch users and send to SQS for i := 0; i < len(users); i += 100 { end := i + 100 if end > len(users) { end = len(users) } batch := users[i:end] message, _ := json.Marshal(batch) _, err := sqsSvc.SendMessage(&sqs.SendMessageInput{ QueueUrl: aws.String("https://sqs.ap-southeast-1.amazonaws.com/account-id/UserProcessedQueue"), // Replace with your SQS URL MessageBody: aws.String(string(message)), }) if err != nil { log.Println(err) } } return "Users batched and sent to SQS!", nil } func main() { lambda.Start(handler) } Build the code into binary: GOOS=linux GOARCH=amd64 go build -o bootstrap main.go Package the binary: zip function.zip bootstrap Deploy to AWS Lambda Function Navigate to the Lambda Service and click the “Create function” button: Choose “Author from scratch” and provide the following details:Function name: Enter a unique name for your function (e.g., FetchUsersNode, FetchUsersPython, or FetchUsersGo).Runtime: Select the runtime that matches your code:Node.js: Choose Node.js 18.x or a compatible version (“node –version”). Python: Choose Python 3.9 or a compatible version (“python3 –version”).Go: Choose Amazon Linux 2023, architecture x86_64, and handler bootstrap (if available).Execution role:Choose "Use an existing role", and select the IAM role you created (e.g., LambdaExecutionRole). Click Create function to submit: A redirect will be performed, scroll down to the Code Source section and choose upload from .zip file: Click “Upload” and choose the destination .zip file to upload, then “Save”. Now we’ll attach the EventBridge rule by scrolling to the “Function overview” section and clicking the “Add trigger” button. Select the “Trigger configuration” to EventBridge (CloudWatch Events). Choose “Create a new rule” and add the schedule setting to the rule as below and Add: Test Our First Lambda Function Navigate to the Test tab in the Lambda function console.Create a new test event: Event name: Enter a name for the test (e.g., TestEvent). Click "Test" to run the function. Check the Execution results and the Logs section to verify the output: Check if the SQS has any message pushed in.  At this point, we've successfully created our first Lambda functions on AWS. It's pretty simple. Just remember to delete any services after use to avoid incurring unnecessary costs! Conclusion In this episode, we practiced creating an AWS Lambda function that automatically triggers at midnight daily, fetches a list of users, and pushes the data to a queue. Through this example, we clearly understood how AWS Lambda operates and integrates with other AWS services like DynamoDB and SQS. However, this is just the beginning! There’s still so much more to explore about the world of AWS Lambda and serverless architecture. In the next episode, we’ll dive into “AWS Lambda Triggers and Events: How AWS Lambda Connects with the World”. Stay tuned for more exciting insights!

    10/01/2025

    807

    Bao Dang D. Q.

    Knowledge

    +0

      Create Your First AWS Lambda Function (Node.js, Python, and Go)

      10/01/2025

      807

      Bao Dang D. Q.

      Knowledge

      Software Development

      +0

        Mastering AWS Lambda: An Introduction to Serverless Computing

        Imagine this: you have a system that sends emails to users to notify them about certain events at specific times of the day or week. During peak hours, the system demands a lot of resources, but it barely uses any for the rest of the time. If you were to dedicate a server just for this task, managing resources efficiently and maintaining the system would be incredibly complex. This is where AWS Lambda comes in as a solution to these challenges. Its ability to automatically scale, eliminate server management, and, most importantly, charge you only for the resources you use simplifies everything. Hello everyone! I’m Đang Đo Quang Bao, a Software Engineer at SupremeTech. Today, I’m excited to introduce the series' first episode, “Mastering AWS Lambda: An Introduction to Serverless Computing.” In this episode, we’ll explore: The definition of AWS Lambda and how it works.The benefits of serverless computing.Real-world use cases. Let’s dive in! What is AWS Lambda? AWS Lambda is a serverless computing service that Amazon Web Services (AWS) provides. It executes your code in response to specific triggers and scales automatically, charging you only for the compute time you use. How Does AWS Lambda Work? AWS Lambda operates on an event-driven model, reacting to specific actions or events. In simple terms, it executes code in response to particular AWS lambda triggers. Let’s explore this model further to gain a more comprehensive understanding. The above is a simplified workflow1 for sending emails to many users simultaneously, designed to give you a general understanding of how AWS Lambda works. The workflow includes: Amazon EventBridge:Role: EventBridge acts as the starting point of the workflow. It triggers the first AWS Lambda function at a specific time each day based on a cron schedule.How It Works:Configured to run automatically at 00:00 UTC or any desired time.Ensures the workflow begins consistently without manual intervention.Amazon DynamoDB:Role: DynamoDB is the primary database for user information. It holds the email addresses and other relevant metadata for all registered users.How It Works:The first Lambda function queries DynamoDB to fetch the list of users who need to receive emails.AWS Lambda (1st Function):Role: This Lambda function prepares the user data for email sending by fetching it from DynamoDB, batching it, and sending it to Amazon SQS.How It Works:Triggered by EventBridge at the scheduled time.Retrieves user data from DynamoDB in a single query or multiple paginated queries.Split the data into smaller batches (e.g., 100 users per batch) for efficient processing.Pushes each batch as a separate message into Amazon SQS.Amazon SQS (Simple Queue Service).Role: SQS serves as a message queue, temporarily storing user batches and decoupling the data preparation process from email-sending.How It Works:Each message in SQS represents one batch of users (e.g., 100 users).Messages are stored reliably and are processed independently by the second Lambda function.AWS Lambda (2nd Function):Role: This Lambda function processes each user batch from SQS and sends emails to the users in that batch.How It Works:Triggered by SQS for every new message in the queue.Reads the batch data (e.g., 100 users) from the message.Sends individual emails to each user in the batch using Amazon SES.Amazon SES (Simple Email Service).Role: SES handles the actual email delivery, reliably ensuring messages reach users’ inboxes.How It Works:Receives the email content (recipient address, subject, body) from the second Lambda function.Delivers emails to the specified users.Provides feedback on delivery status, including successful deliveries, bounces, and complaints. As you can see, AWS Lambda is triggered by external events or actions (AWS EventBridge schedule) and only "lives" for the duration of its execution. >>> Maybe you are interested: The Rise of Serverless CMS SolutionsCreate Your First AWS Lambda Function (Node.js, Python, and Go) Benefits of AWS Lambda No Server Management:Eliminate the need to provision, configure, and maintain servers. AWS handles the underlying infrastructure, allowing developers to focus on writing code.Cost Efficiency:Pay only for the compute time used (measured in milliseconds). There are no charges when the function isn’t running.Scalability:AWS Lambda automatically scales horizontally to handle thousands of requests per second.Integration with AWS Services:Lambda integrates seamlessly with services like S3, DynamoDB, and SQS, enabling event-driven workflows.Improved Time-to-Market:Developers can deploy and iterate applications quickly without worrying about managing infrastructure. Real-World Use Cases for AWS Lambda AWS Lambda is versatile and can be applied in various scenarios. Here are some of the most common and impactful use cases: Real-Time File ProcessingExample: Automatically resizing images uploaded to an Amazon S3 bucket.How It Works:An upload to S3 triggered a Lambda function.The function processes the file (e.g., resizing or compressing an image).The processed file is stored back in S3 or another storage system.Why It’s Useful:Eliminates the need for a dedicated server to process files.Automatically scales based on the number of uploads.Building RESTful APIsExample: Creating a scalable backend for a web or mobile application.How It Works:Amazon API Gateway triggers AWS Lambda in response to HTTP requests.Lambda handles the request, performs necessary logic (e.g., CRUD operations), and returns a response.Why It’s Useful:Enables fully serverless APIs.Simplifies backend management and scaling.IoT ApplicationsExample: Processing data from IoT devices.How It Works:IoT devices publish data to AWS IoT Core, which triggers Lambda.Lambda processes the data (e.g., analyzing sensor readings) and stores results in DynamoDB or ElasticSearch.Why It’s Useful:Handles bursts of incoming data without requiring a dedicated server.Integrates seamlessly with other AWS IoT services.Real-Time Streaming and AnalyticsExample: Analyzing streaming data for fraud detection or stock market trends.How It Works:Events from Amazon Kinesis or Kafka trigger AWS Lambda.Lambda processes each data stream in real time and outputs results to an analytics service like ElasticSearch.Why It’s Useful:Allows real-time data insights without managing complex infrastructure.Scheduled TasksExample: Running daily tasks/reports or cleaning up expired data.How It Works:Amazon EventBridge triggers Lambda at scheduled intervals (e.g., midnight daily).Lambda performs tasks like querying a database, generating reports, or deleting old records.Why It’s Useful:Replaces traditional cron jobs with a scalable, serverless solution. Conclusion AWS Lambda is a powerful service that enables developers to build highly scalable, event-driven applications without managing infrastructure. Lambda simplifies workflows and accelerates time-to-market by automating tasks and seamlessly integrating with other AWS services like EventBridge, DynamoDB, SQS, and SEStime to market. We’ve explored the fundamentals of AWS Lambda, including its definition, how it works, its benefits, and its application in real-world use cases. It offers an optimized and cost-effective solution for many scenarios, making it a vital tool in modern development. At SupremeTech, we’re committed to harnessing innovative technologies to deliver impactful solutions. This is just the beginning of our journey with AWS Lambda. In upcoming episodes, we’ll explore hơ to optimize AWS Lambda functions in different programming languages and uncover best practices for building efficient serverless applications. Stay tuned, and let’s continue mastering AWS Lambda together! Note: 1.  This workflow is for reference purposes only and is not an optimized solution.

        25/12/2024

        1.14k

        Bao Dang D. Q.

        Knowledge

        +1

        • Software Development

        Mastering AWS Lambda: An Introduction to Serverless Computing

        25/12/2024

        1.14k

        Bao Dang D. Q.

        Automate your git flow with git hooks

        Knowledge

        +0

          Automate Your Git Workflow with Git Hooks for Efficiency

          Have you ever wondered how you can make your Git workflow smarter and more efficient? What if repetitive tasks like validating commit messages, enforcing branch naming conventions, or preventing sensitive data leaks could happen automatically? Enter Git Hooks—a powerful feature in Git that enables automation at every step of your development process. If you’ve worked with webhooks, the concept of Git Hooks might already feel familiar. Like API events trigger webhooks, Git Hooks are scripts triggered by Git actions such as committing, pushing, or merging. These hooks allow developers to automate tasks, enforce standards, and improve the overall quality of their Git workflows. By integrating Git Hooks into your project, you can gain numerous benefits, including clearer commit histories, fewer human errors, and smoother team collaboration. Developers can also define custom rules tailored to their Git flow, ensuring consistency and boosting productivity. In this SupremeTech blog, I, Đang Đo Quang Bao, will introduce you to Git Hooks, explain how they work, and guide you through implementing them to transform your Git workflow. Let’s dive in! What Are Git Hooks? Git Hooks are customizable scripts that automatically execute when specific events occur in a Git repository. These events might include committing code, pushing changes, or merging branches. By leveraging Git Hooks, you can tailor Git's behavior to your project's requirements, automate repetitive tasks, and reduce the likelihood of human errors. Imagine validating commit messages, running tests before a push, or preventing large file uploads—all without manual intervention. Git Hooks makes this possible, enabling developers to integrate useful automation directly into their workflows. Type of Git Hooks Git Hooks come in two main categories, each serving distinct purposes: Client-Side Hooks These hooks run on the user’s local machine and are triggered by actions like committing or pushing changes. They are perfect for automating tasks like linting, testing, or enforcing commit message standards. Examples:pre-commit: Runs before a commit is finalized.pre-push: Executes before pushing changes to a remote repository.post-merge: Triggers after merging branches. Server-Side Hooks These hooks operate on the server hosting the repository and are used to enforce project-wide policies. They are ideal for ensuring consistent workflows across teams by validating changes before they’re accepted into the central repository. Examples: pre-receive: Runs before changes are accepted by the remote repository.update: Executes when a branch or tag is updated on the server. My Journey to Git Hooks When I was working on personal projects, Git management was fairly straightforward. There were no complex workflows, and mistakes were easy to spot and fix. However, everything changed when I joined SupremeTech and started collaborating on larger projects. Adhering to established Git flows across a team introduced new challenges. Minor missteps—like inconsistent commit messages, improper branch naming, accidental force pushes, or forgetting to run unit tests—quickly led to inefficiencies and avoidable errors. That’s when I discovered the power of Git Hooks. By combining client-side Git Hooks with tools like Husky, ESLint, Jest, and commitlint, I could automate and streamline our Git processes. Some of the tasks I automated include: Enforcing consistent commit message formats.Validating branch naming conventions.Automating testing and linting.Preventing accidental force pushes and large file uploads.Monitoring and blocking sensitive data in commits. This level of automation was a game-changer. It improved productivity, reduced human errors, and allowed developers to focus on their core tasks while Git Hooks quietly enforced the rules in the background. It transformed Git from a version control tool into a seamless system for maintaining best practices. Getting Started with Git Hooks Setting up Git Hooks manually can be dull, especially in team environments where consistency is critical. Tools like Husky simplify the process, allowing you to manage Git Hooks and integrate them into your workflows easily. By leveraging Husky, you can unlock the full potential of Git Hooks with minimal setup effort. I’ll use Bun as the JavaScript runtime and package manager in this example. If you’re using npm or yarn, replace Bun-specific commands with their equivalents. Setup Steps 1. Initialize Git: Start by initializing a Git repository if one doesn’t already exist git init 2. Install Husky: Use Bun to add Husky as a development dependency bun add -D husky 3. Enable Husky Hooks: Initialize Husky to set up Git Hooks for your project bunx husky init 4. Verify the Setup: At this point, a folder named .husky will be created, which already includes a sample of pre-commit hook. With this, the setup for Git Hooks is complete. Now, let’s customize it to optimize some simple processes. Examples of Git Hook Automation Git Hooks empowers you to automate tedious yet essential tasks and enforce team-wide best practices. Below are four practical examples of how you can leverage Git Hooks to improve your workflow: Commit Message Validation Ensuring consistent and clear commit messages improves collaboration and makes Git history easier to understand. For example, enforce the following format: pbi-203 - refactor - [description…] [task-name] - [scope] - [changes] Setup: Install Commitlint: bun add -D husky @commitlint/{config-conventional,cli} Configure rules in commitlint.config.cjs: module.exports = {     rules: {         'task-name-format': [2, 'always', /^pbi-\d+ -/],         'scope-type-format': [2, 'always', /-\s(refactor|fix|feat|docs|test|chore|style)\s-\s[[^\]]+\]$/]     },     plugins: [         {             rules: {                 'task-name-format': ({ raw }) => {                     const regex = /^pbi-\d+ -/;                     return [regex.test(raw),                         `❌ Commit message must start with "pbi-<number> -". Example: "pbi-1234 - refactor - [optimize function]"`                     ];                 },                 'scope-type-format': ({ raw}) => {                     const regex = /-\s(refactor|fix|feat|docs|test|chore|style)\s-\s[[^\]]+\]$/;                     return [regex.test(raw),                         `❌ Commit message must include a valid scope and description. Example: "pbi-1234 - refactor - [optimize function]".                         \nValid scopes: refactor, fix, feat, docs, test, chore, style`                     ];                 }             }         }     ] } Add Commitlint to the commit-msg hook: echo "bunx commitlint --edit \$1" >> .husky/commit-msg With this, we have completed the commit message validation setup. Now, let’s test it to see how it works. Now, developers will be forced to follow this committing rule, which increases the readability of the Git History. Automate Branch Naming Conventions Enforce branch names like feature/pbi-199/add-validation. First, we will create a script in the project directory named scripts/check-branch-name.sh. #!/bin/bash # Define allowed branch naming pattern branch_pattern="^(feature|bugfix|hotfix|release)/pbi-[0-9]+/[a-zA-Z0-9._-]+$" # Get the current branch name current_branch=$(git symbolic-ref --short HEAD) # Check if the branch name matches the pattern if [[ ! "$current_branch" =~ $branch_pattern ]]; then   echo "❌ Branch name '$current_branch' is invalid!"   echo "✅ Branch names must follow this pattern:"   echo "   - feature/pbi-<number>/<description>"   echo "   - bugfix/pbi-<number>/<description>"   echo "   - hotfix/pbi-<number>/<description>"   echo "   - release/pbi-<number>/<description>"   exit 1 fi echo "✅ Branch name '$current_branch' is valid." Add the above script execution command into the pre-push hook. echo "bash ./scripts/check-branch-name.sh" >> .husky/pre-push Grant execute permissions to the check-branch-name.sh file. chmod +x ./scripts/check-branch-name.sh Let’s test the result by pushing our code to the server. Invalid case: git checkout main git push Output: ❌ Branch name 'main' is invalid! ✅ Branch names must follow this pattern:   - feature/pbi-<number>/<description>   - bugfix/pbi-<number>/<description>   - hotfix/pbi-<number>/<description>   - release/pbi-<number>/<description> husky - pre-push script failed (code 1) Valid case: git checkout -b feature/pbi-100/add-new-feature git push Output: ✅ Branch name 'feature/pbi-100/add-new-feature' is valid. Prevent Accidental Force Pushes Force pushes can overwrite shared branch history, causing significant problems in collaborative projects. We will implement validation for the prior pre-push hook to prevent accidental force pushes to critical branches like main or develop. Create a script named scripts/prevent-force-push.sh. #!/bin/bash # Define the protected branches protected_branches=("main" "develop") # Get the current branch name current_branch=$(git symbolic-ref --short HEAD) # Check if the current branch is in the list of protected branches if [[ " ${protected_branches[@]} " =~ " ${current_branch} " ]]; then # Check if the push is a force push for arg in "$@"; do   if [[ "$arg" == "--force" || "$arg" == "-f" ]]; then     echo "❌ Force pushing to the protected branch '${current_branch}' is not allowed!"     exit 1   fi done fi echo "✅ Push to '${current_branch}' is valid." Add the above script execution command into the pre-push hook. echo "bash ./scripts/prevent-force-push.sh" >> .husky/pre-push Grant execute permissions to the check-branch-name.sh file. chmod +x ./scripts/prevent-force-push.sh Result: Invalid case: git checkout main git push -f Output: ❌ Force pushing to the protected branch 'main' is not allowed! husky - pre-push script failed (code 1) Valid case: git checkout main git push Output: ✅ Push is valid. Monitor for Secrets in Commits Developers sometimes unexpectedly include sensitive data in commits. We will set up a pre-commit hook to scan files for sensitive patterns before committing to prevent accidental commits containing sensitive information (such as API keys, passwords, or other secrets). Create a script named scripts/monitor-secrets-with-values.sh. #!/bin/bash # Define sensitive value patterns patterns=( # Base64-encoded strings "([A-Za-z0-9+/]{40,})={0,2}" # PEM-style private keys "-----BEGIN RSA PRIVATE KEY-----" "-----BEGIN OPENSSH PRIVATE KEY-----" "-----BEGIN PRIVATE KEY-----" # AWS Access Key ID "AKIA[0-9A-Z]{16}" # AWS Secret Key "[a-zA-Z0-9/+=]{40}" # Email addresses (optional) "[a-zA-Z0-9._%+-]+@[a-zA-Z0-9.-]+\.[a-zA-Z]{2,}" # Others (e.g., passwords, tokens) ) # Scan staged files for sensitive patterns echo "🔍 Scanning staged files for sensitive values..." # Get the list of staged files staged_files=$(git diff --cached --name-only) # Initialize a flag to track if any sensitive data is found found_sensitive_data=false # Loop through each file and pattern for file in $staged_files; do # Skip binary files if [[ $(file --mime-type -b "$file") == "application/octet-stream" ]]; then   continue fi # Scan each pattern using grep -E (extended regex) for pattern in "${patterns[@]}"; do   if grep -E -- "$pattern" "$file"; then     echo "❌ Sensitive value detected in file '$file': Pattern '$pattern'"     found_sensitive_data=true     break   fi done done # If sensitive data is found, prevent the commit if $found_sensitive_data; then echo "❌ Commit aborted. Please remove sensitive values before committing." exit 1 fi echo "✅ No sensitive values detected. Proceeding with committing." Add the above script execution command into the pre-commit hook. echo "bash ./scripts/monitor-secrets-with-values.sh" >> .husky/pre-commit Grant execute permissions to the monitor-secrets-with-values.sh file. chmod +x ./scripts/monitor-secrets-with-values.sh Result: Invalid case: git add private git commit -m “pbi-002 - chore - add unexpected private file” Result: 🔍 Scanning staged files for sensitive values... -----BEGIN OPENSSH PRIVATE KEY----- ❌ Sensitive value detected in file 'private': Pattern '-----BEGIN OPENSSH PRIVATE KEY-----' ❌ Commit aborted. Please remove sensitive values before committing. husky - pre-commit script failed (code 1) Valid case: git reset private git commit -m “pbi-002 - chore - remove unexpected private file” Result: 🔍 Scanning staged files for sensitive values... ✅ No sensitive values detected. Proceeding with commit. [main c575028] pbi-002 - chore - remove unexpected private file 4 files changed, 5 insertions(+) create mode 100644 .env.example create mode 100644 .husky/commit-msg create mode 100644 .husky/pre-commit create mode 100644 .husky/pre-push Conclusion "Humans make mistakes" in software development; even minor errors can disrupt workflows or create inefficiencies. That’s where Git Hooks come in. By automating essential checks and enforcing best practices, Git Hooks reduces the chances of errors slipping through and ensures a smoother, more consistent workflow. Tools like Husky make it easier to set up Git Hooks, allowing developers to focus on writing code instead of worrying about process compliance. Whether it’s validating commit messages, enforcing branch naming conventions, or preventing sensitive data from being committed, Git Hooks acts as a safety net that ensures quality at every step. If you want to optimize your Git workflow, now is the time to start integrating Git Hooks. With the proper setup, you can make your development process reliable but also effortless and efficient. Let automation handle the rules so your team can focus on building great software.

          24/12/2024

          1.54k

          Bao Dang D. Q.

          Knowledge

          +0

            Automate Your Git Workflow with Git Hooks for Efficiency

            24/12/2024

            1.54k

            Bao Dang D. Q.

            Knowledge

            Software Development

            +0

               Exploring API Performance Testing with Postman

              Hello, tech enthusiasts and creative developers! I’m Vu, the author of SupremeTech’s performance testing series. In the article “The Ultimate Guide to JMeter Performance Testing Tool,” we explored JMeter's strengths and critical role in performance testing. Today, I’m introducing an exciting and straightforward way to do API performance testing using Postman. What is Postman? Postman is a robust API (Application Programming Interface) platform that empowers developers to quickly design, test, document, and interact with APIs. It is a widely used tool for testing APIs, which is valuable in software development, primarily web or mobile app development. Why Use Postman for API Testing? Postman is favored by software developers, testers, and API specialists because of its many advantages: User-Friendly Interface: Postman’s intuitive design makes it easy to use.Supports Diverse HTTP Methods: It handles requests such as GET, POST, PUT, DELETE, PATCH, OPTIONS, and more.Flexible Configuration: Easily manage API request headers, parameters, and body settings.Test Automation with Scripts: Write JavaScript code within the Tests tab to automate API response validation.Integration with CI/CD: Postman's CLI tool, Newman, seamlessly integrates with CI/CD pipelines, enabling automated API testing in development workflows.API Documentation and Sharing: Create and share API documentation with team members or clients effortlessly. Performance API Testing on Postman As of mid-2024, Postman introduced a new feature allowing users to perform API performance testing quickly and conveniently. With just a few simple steps, you can evaluate your API’s performance under high load and ensure its strength. Step 1: Select the Collection for Performance Testing Open Postman and navigate to the Collections tab on the left sidebar.Choose the Collection or Folder you want to test. Step 2: Launch the Collection Runner After selecting your desired Collection or Folder, click Run Collection to open the Collection Runner window.In the Runner, select the APIs you want to include in the performance test.Switch to the Performance tab and choose a simulation method:Fixed: Simulates a fixed number of users.Ramp Up: Starts with a few users and gradually increases.Spike: Introduces a sudden surge in traffic followed by a reduction.Peak: Increases traffic to a high level and sustains it for a period. Step 3: Adjust Virtual Users and Test Duration Configure the Virtual Users and Test Duration settings to simulate the desired load.Start with smaller values, then gradually increase them to gain a clear understanding of your API's performance under varying conditions. Step 4: Run the Test Click Run to start the performance test.During the test, Postman will send API requests and provide real-time data on:Response Time: The API's duration to respond to a request.Error Rate: The percentage of failed requests.Throughput: The number of API requests the system can handle per second. Step 5: Analyze the Report Once the test is complete, Postman generates a detailed report, including: Response Time: Tracks the duration it takes for APIs to process requests.Error Rate: Highlights any issues encountered during testing.Throughput: Measures the system's capacity to process requests under load. Use these metrics to evaluate whether your API performs efficiently under heavy traffic. These insights will guide you in optimizing your API for better performance. Leverage Customization for Realistic User Simulation Postman allows you to customize request data for each virtual user. You can upload a CSV or JSON file with unique datasets if you want different data for each user. This feature enables a more accurate simulation of real-world user behavior. After each test run, Postman provides an easy-to-understand report highlighting the areas for improvement. You can track performance changes and compare test results to identify weaknesses and refine your API. Test and Optimize Your API with Postman With Postman’s new performance testing feature, API optimization has never been easier. It helps you quickly identify and address potential issues to ensure your system is always ready to handle user demands effectively and reliably.   For more details and step-by-step guidance, check out the following resources on the Postman website:   OverviewRun a performance testView performance test metricsDebug performance test errorsInject data into virtual users Start your API performance optimization journey with Postman and prepare your system to meet every demand seamlessly. >>> Explore more articles about performance testing: SupremeTech’s Expertise in the Process of Performance Testing

              23/12/2024

              1.11k

              Vu Nguyen Q.

              Knowledge

              +1

              • Software Development

               Exploring API Performance Testing with Postman

              23/12/2024

              1.11k

              Vu Nguyen Q.

              Knowledge

              Software Development

              +0

                From Raw Data to Perfect API Responses: Serialization in NestJS

                Hello, My name is Dzung. I am a developer who has been in this game for approximately 6 years. I've just started exploring NestJS and am excited about this framework's capabilities. In this blog, I want to share the knowledge I’ve gathered and practiced in NestJS. Today's topic is serialization! As you know, APIs are like the messengers of your application, delivering data from the backend to the client side. Without proper control, they might spill too much information, such as passwords or internal settings. This is where serialization in NestJS steps in, turning messy, raw data into polished, purposeful API responses. With the power of serialization, you can control exactly what your users see, hide sensitive fields, format nested objects, and deliver secure, efficient, and downright beautiful responses. In this blog, we’ll explore how serialization in NestJS works, why it’s a must-have skill for any developer, and how to implement it step by step. Your APIs will go from raw and unrefined to clean and professional by the end. Let’s dive in! What Happens Without Serialization? Let’s look at what happens when you don’t use serialization in your NestJS application. Imagine you’re building a user management system, and you create an API endpoint to fetch user details. Here’s your User entity: Now, you write a simple endpoint to fetch a user: What happens when you call this endpoint? The API sends the entire user object straight to the client—every single field included: The consequences of lacking Serialization in the NestJS application Security Risks: Sensitive data, like passwords, should never be exposed in API responses.Data Overload: Users and clients don’t need internal flags or timestamps—they just add noise.Lack of Professionalism: Messy, unfiltered responses make your API look unpolished and unreliable. Next, we’ll see how to clean up this mess and craft polished API responses using NestJS serialization techniques. The Differences in Applying Serialization By implementing serialization in your NestJS application, you can take full control over what data is exposed in your API responses. Let’s revisit the previous example and clean it up. Step 1: Install class-transformer To get started with serialization, you need the class-transformer package. Install it with: Step 2: Update the User Entity with Exposed or Excluded Decorator Use class-transformer decorators to specify which fields should be exposed or excluded. Only the ID and email fields will be included in the response. Step 3: Apply the Serializer Interceptor NestJS provides a built-in ClassSerializerInterceptor to handle serialization. You can apply it at different levels: Per-Controller Globally To apply serialization to all controllers, add the interceptor to the application setup: When the Get User Endpoint is called, this is what your API will now return: Why Serialization Makes a Difference Security: Sensitive fields are automatically excluded, keeping your data safe.Clarity: Only the necessary fields are sent, reducing noise and improving usability.Professionalism: Clean and consistent responses give your API a polished look. Dynamic Serialization with Group What if you want to show different data to users, such as admins versus regular users? The class-transformer package supports groups, allowing you to expose fields based on context. Example: In the controller, specify the group for the transformation: When the Get User Endpoint is called, this is what your API will now return: By incorporating serialization into your NestJS application, you not only improve security but also enhance the user experience by providing streamlined, predictable, and professional API responses. Now that you know how serialization works in NestJS, you can apply these techniques to your projects, creating safer, cleaner, and more maintainable APIs. SupremeTech has lots of experience and produces web or app services. Let’s schedule a call now if you want to work with us. Also, now we are hiring! Please check open positions for career opportunities.

                20/12/2024

                1.35k

                Dung Nguyen Q.

                Knowledge

                +1

                • Software Development

                From Raw Data to Perfect API Responses: Serialization in NestJS

                20/12/2024

                1.35k

                Dung Nguyen Q.

                Knowledge

                +0

                  Atomic Design In Software Development

                  Hello everyone! I'm Linh, a front-end developer passionate about discovering effective methods for system development. When I first entered the tech industry, I faced challenges organizing UI components logically and reusable. This experience motivated me to seek strategies to optimize my workflow while ensuring that the products I developed were easy to scale and maintain. Recently, I explored the concept of Atomic Design, which has become a guiding principle for me in tackling these challenges more systematically and scientifically. This approach has significantly influenced my design thinking. Through this article, I aim to inspire you and offer a fresh perspective if you're also looking for solutions for your systems. Taking Cues From Chemistry Looking for a way to build and create a design system reminds me of developments in other fields and industries. Many areas, such as design and architecture, have developed smart modular systems to produce incredibly complex things like airplanes, ships, and skyscrapers. These thoughts take me back to my school days in chemistry labs. The idea is that all matter—whether solid, liquid, gas, simple, or complex—is made up of atoms. These atoms bond to form molecules, which combine into more complex organisms, eventually creating everything in our universe. Similarly, systems built up from smaller components are more logical and connected. We can break the entire system into basic building blocks and work from there. That’s the core idea of atomic design. What Is Atomic Design? Atomic Design is an interface design methodology that focuses on creating a system of components rather than entire pages. Introduced by Brad Frost in 2013, this approach emphasizes using small, independent elements that can be reused and combined to form a cohesive whole. This strategy facilitates quicker product development, promotes a unified interface, and simplifies maintenance. “Atomic Design is a methodology where designers prioritize creating individual components and then combine them, rather than designing entire pages.” Atomic Design can enhance the design development process, promoting consistency, adaptability, and efficiency across projects. By applying the principles of Atomic Design, developers and designers can collaborate within a cohesive design system, ultimately delivering a scalable and high-quality user experience. Atomic Design organizes components into five levels, progressing from simple to complex, as illustrated above: Atoms: These are the most basic components, such as HTML tags like buttons, inputs, labels, and icons.Molecules are combinations of two or more atoms that create more complex components. For example, a form group consists of an input and a label.Organisms are more complex UI components of multiple molecules and/or atoms. For instance, a form can comprise several form groups and buttons.Templates are layout frameworks created from organisms and molecules. They define how these components are arranged on a page but do not contain actual data or content; they represent an abstract structure.Pages: These are specific instances of templates where real content is added to create complete web pages or applications. Pages include all necessary components—atoms, molecules, organisms, and templates—along with specific content for end users to interact with. In the following sections, we will explore each level of Atomic Design in detail. Atoms Similar to atoms in nature, these elements may seem abstract, but they are the foundational building blocks of all our user interfaces. In web interfaces, atoms are the fundamental HTML elements, such as labels, inputs, and buttons. As the smallest components, they cannot be broken down any further. Atoms can also be abstract concepts, including colors, fonts, and even more intangible UI aspects, like animations. Molecules When we combine atoms, things become more interesting and tangible. Molecules are groups of atoms that bond together and serve as the minor basic units of a compound. They possess unique properties and act as core elements within our design system. For example, when atoms like labels, inputs, or buttons stand alone, they are useless. However, when combined into a form, they can work effectively together. Molecules can be simple or complex and designed for reuse or one-time use. A molecule can have multiple variants (similar to components in a Variant in Figma) intended for different contexts or interactions (such as hover, pressing, or after a delay). Organisms Molecules provide us with building blocks to combine to create organisms. Organisms are groups of molecules that come together to form a more complex and complete structure. Organisms can consist of similar or different elements. For instance, a website header might include a logo, menu, and search box. When you visit the category page of most e-commerce websites, you'll see product listings displayed in a grid format, composed of smaller components like images, titles, captions, etc. Templates Templates are combinations of organisms that create complete pages. They focus on the basic content structure rather than the final content. Templates help clearly define important properties such as image sizes and text lengths, thereby establishing an effective system for managing dynamic content and ensuring alignment with the design. “You can create good experiences without knowing the content. What you can’t do is create good experiences without knowing your content structure. What is your content made from, not what your content is?” Pages Pages are specific instances of templates. Placeholder content is replaced with representative content to depict what end users will see accurately. In simpler terms, pages are templates filled with real data for presentation purposes, offering the most realistic view of the design. Developers and designers will test how templates work with actual content, allowing designers to return and adjust to molecules, organisms, and templates as needed. >>> Maybe you are interested: Differences In UX Demands Of A Desktop And Mobile App For A SaaS ProductTop 10 Design Tools For UX And UITop Emerging Trends In App UI Design Benefits Of Applying Atomic Design In User Interface (UI) Design Consistency Atomic Design utilizes a modular approach, ensuring each interface element adheres to a consistent design language. When a component, such as a button or color, is modified or updated, these changes are automatically reflected across all pages, maintaining uniformity throughout the product. This consistency is crucial for large and complex design teams, where smooth and synchronized updates are essential. Reusability Reusability is one of the most significant advantages of Atomic Design. By defining basic components in a standardized way, you can reuse them throughout different contexts and parts of the product. Due to this reusability, designers and developers can quickly integrate complex interfaces from standardized small components. For example, a button designed according to the standards can be used on various pages, from the homepage to product pages and forms, without needing to be recreated. This not only minimizes repetitive work but also ensures consistency across the entire design system. Atomic Design's reusability also promotes flexibility. It allows for easy updates or replacements of a component across the system without changing every detail on each page. Maintainability Atomic Design enables designers and developers to efficiently monitor and modify specific interface parts without impacting the entire system. The team can directly adjust the associated atoms or molecules when updates are required for a component, such as a button or color. These changes will automatically be reflected across all instances of that component. This approach reduces errors, minimizes repetitive tasks, and ensures that updates are consistently applied throughout the system. Scalability Like maintainability, Atomic Design allows designers and developers to expand the system by adding new components at the appropriate levels without disrupting the overall structure. For instance, if a new type of button or content combination is needed, the team can create new atoms or molecules and seamlessly integrate them into existing organisms and templates. This method enables a system to quickly scale from a small application to larger, more complex products with many new pages and features while maintaining structural integrity. Atomic Design's scalability ensures that products can evolve continuously and improve while minimizing the effort required for updates or adjustments to meet new demands. This helps products quickly adapt to changing user needs and market conditions. A prime example of successfully implementing Atomic Design principles in UI design is the Shopee UI Design System. Shopee is building its interface systems based on Atomic Design principles to maintain consistency across its entire product range. By applying Atomic Design to fundamental components such as buttons, colors, and font families (Atoms), as well as groups of components like product lists (Molecules) and elements like navigation bars or product carousels (Organisms), Shopee enhances development speed through the reuse of standardized components, ensuring a consistent interface across multiple platforms. Reality Use-Cases Atomic Design is a robust methodology for creating user interfaces (UI) that has been extensively utilized in various open-source projects. Below are some notable systems that SupremeTech has adopted and incorporated into its client solutions: Shopify Polaris Design System Shopify uses Polaris to create a consistent interface for all applications related to Shopify. Similar to Shopee UI, Shopify Polaris applies the levels of Atoms, Molecules, and Organisms from Atomic Design into its design system. This helps Shopify enhance development efficiency and maintain long-term product quality. MedusaJS As an open-source e-commerce platform, MedusaJS implements atomic design to organize the UI components for its Storefront and Admin Dashboard. Storefront UI: When building the Shopify Storefront interface for Medusa.js projects, Atomic Design helps organize UI components hierarchically. 1. Atoms: Button:  Add to Cart button, View Product button.Text: Product title, price.Icon: Shopping cart icon, search icon. 2. Molecules: Product Card: Includes an image, title, price, and Add to Cart button.Navbar: Contains the logo, menu links, and search bar. 3. Organisms: Product Grid: A grid of product cards.Header: Combines the logo, navigation bar, and mini cart. 4. Templates: Product detail pages or product category pages. 5. Pages: Homepage, checkout page. Admin Dashboard: Medusa.js also requires an admin UI to manage products, orders, and customers. Atomic Design helps organize the admin interface. 1. Atoms: Input: Input fields (product name, price).Button: Save, Delete, or Add product buttons.Badge: Displays order status (completed, processing). 2. Molecules: Search Bar: Search input field with a button and icon.Table Row: A row in a data table (product, order). 3. Organisms: Data Table: Displays a list of products or orders.Sidebar: Navigation menu for sections like Products and Orders. 4. Templates: Product list page with sidebar and data table. 5. Pages: Product management page, order management page. By applying Atomic Design, MedusaJS achieves: Component reusability: UI components like buttons, forms, or cards can be reused in both the storefront and admin dashboard.Easy expansion: When adding new features (e.g., wishlist or promotional modules), you can combine existing Atoms, Molecules, and Organisms.Consistency assurance: Atomic Design ensures that components are uniformly designed from the admin interface to the storefront.Facilitated collaboration: Design and development teams can collaborate on a transparent hierarchical system. Wrapping Up Atomic Design is a valuable method in design and development; fundamentally, it serves as a framework for building user interfaces. The immediate benefits include time and cost savings, improved product consistency, enhanced team collaboration, support for accessibility efforts, and strategic long-term initiatives. These reasons drive organizations to adopt design systems. Mastering the core principles of modern design systems will help you grow as a designer or developer.

                  16/12/2024

                  917

                  Linh Nguyen D. Q.

                  Knowledge

                  +0

                    Atomic Design In Software Development

                    16/12/2024

                    917

                    Linh Nguyen D. Q.

                    Knowledge

                    +0

                      The Ultimate Guide to JMeter Performance Testing Tool

                      At SupremeTech, we are dedicated to creating technology products that provide the best user experience. In this article, I will introduce you to JMeter performance testing, a powerful and flexible tool that significantly enhances the quality of technology products. With its ability to support various protocols, JMeter allows you to test the performance of a wide range of applications, from web services to APIs and even real-time applications. Let’s explore the types of applications JMeter can be applied to and the outstanding features it offers! For more insights into Performance Testing, check out our blogs below: The Process of Performance Testing at SupremeTechPerform API Testing using Postman Applications Suitable for JMeter Web Applications For applications using HTTP/HTTPS protocols, such as e-commerce sites, blogs, or corporate websites, JMeter can help assess response times and system performance. RESTful APIs JMeter supports load testing for APIs, measuring response times, and checking stability. Real-Time Applications (WebSocket Applications) For applications that require real-time communication, such as chat applications or online games, JMeter offers performance testing with the WebSocket Sampler Plugin, ideal for messaging systems or online monitoring. Mobile Applications JMeter can simulate requests from mobile applications to their backend APIs, such as food delivery apps or digital banking services. Database-Driven Applications For applications that rely on database queries, like CRM or ERP systems, JMeter supports performance testing using the JDBC Request Plugin to evaluate database efficiency. Custom Protocol Applications For applications using unique protocols like TCP or UDP, JMeter allows for performance simulation and testing using the TCP Sampler, which benefits  IoT applications or data transmission over local networks. Why Should Use JMeter Performance Testing Tool? Advantages Free and open source: JMeter is a cost-free tool that is easy to use.Multi-protocol support: It supports protocols like HTTP, FTP, SOAP, REST, etc.User-friendly interface: It provides an intuitive graphical interface suitable for beginners.Scalability: Supports plugins and can integrate with CI/CD tools like Jenkins.Detailed measurement: Offers comprehensive reports on performance metrics such as latency, error rates, and response times.Distributed testing: Allows load testing across multiple servers to simulate high traffic volumes. Disadvantages    Performance limitations under heavy load: JMeter may struggle with extremely high loads due to resource consumption.Not optimized for UI testing: JMeter might not be the best choice if you need to test complex user interfaces.Limited scripting flexibility: While it uses BeanShell and Groovy scripts, it lacks the flexibility of some other tools.Complex result analysis: Default reports from JMeter may not be intuitive and require external tools for advanced analysis.Learning curve: The complex features of JMeter can take time to master. What You Should Know About JMeter Plugins Plugins are an integral part of JMeter that significantly enhance its testing capabilities. Some notable plugins include: JMeter Plugins Manager: Easily manage plugins without manual configuration.PerfMon Metrics Collector: Monitors system resources like CPU, RAM, Disk, and Network during tests.JDBC Request Plugin: Tests database performance through JDBC.WebSocket Sampler: Supports WebSocket protocol testing for real-time applications.Throughput Shaping Timer: Adjusts request rates to achieve desired throughput.ElasticSearch Backend Listener: Integrates with ElasticSearch and Kibana for data analysis and visualization. Types of Reports Provided by JMeter JMeter offers various reports to help analyze and evaluate system performance: Dashboard Report: Provides an overview with graphs and data tables to track throughput, response times, and error rates.Aggregate Report: Supplies detailed aggregated data about each sampler or group of requests.Graph Results: Displays graphs showing changes in response times and throughput over time.Response Time Distribution: Shows response time distribution to identify acceptable thresholds. JMeter is a necessary tool for testers performing performance testing across various applications and protocols. Despite some limitations, its support for plugins and detailed reporting makes monitoring and analyzing system performance easy. Best of all, it is completely free! Make the most of JMeter to ensure your application runs smoothly in testing and production environments.

                      10/12/2024

                      875

                      Vu Nguyen Q.

                      Knowledge

                      +0

                        The Ultimate Guide to JMeter Performance Testing Tool

                        10/12/2024

                        875

                        Vu Nguyen Q.

                        Knowledge

                        +0

                          SupremeTech’s Expertise in the Process of Performance Testing

                          In the previous article discussing The Importance of Performance Testing and SupremeTech's Expertise, we understood the overview of performance testing and its significance for businesses. Let me introduce how SupremeTech manages performance and the process of performance testing to ensure our products are always ready to face real-world challenges. At SupremeTech, product performance is not just a priority but a commitment. So how to do performance testing? Below is a detailed process of performance testing that we implement to ensure applications operate stably and efficiently under any usage conditions. For more insights into Performance Testing, check out our blogs below: The Ultimate Guide to an Essential JMeter Performance Testing Tool Step 1: Application Optimization   1.1 Optimizing OPCache Infrastructure Team Responsible for configuring and fine-tuning OPCache on the server.Ensures that JIT (Just-In-Time) caching is enabled and that parameters align with system resources. 1.2 Database Optimization Back End Team Designs composite indexes to enhance query speed.Rewrites or optimizes SQL queries to improve efficiency and reduce execution time.Analyzes common queries and data flows. 1.3 Optimizing Laravel During Deployment Back End Team Considers activating Production Mode in Laravel.Executes the command php artisan optimize to optimize application configurations. Infrastructure Team Manages caching for configurations, routes, and views.Supports the deployment and integration of queues or jobs on the server system. Step 2: Preparing for Performance Testing Collaboration among teams is crucial to ensure that every preparation step is accurate and ready for the performance testing process. 2.1 Developing a Plan and Initial Estimates QC Team, Back-End Team Creates a detailed plan for each phase of performance testing.Proposes resource, time, and data requirements. Project Technical Leader (PTL) Reviews and approves the testing plan.Coordinates appropriate resources based on preliminary estimates. 2.2 Security Checklist Project Technical Leader (PTL) Develops a checklist of security factors to protect the system during testing. QC Team, Back End Team Review the checklist to ensure completeness and accuracy. 2.3 Preparing Test Data QC Team Creates accounts, test data, and detailed test scenarios.Writes test scripts to automate testing steps. Back End Team Assists in building complex test data or necessary APIs.Reviews and tests scripts to ensure logic aligns with the actual system. Step 3: Setting Up the Testing Environment Coordination between the QC and Infrastructure teams is essential to ensure an optimized testing environment is ready for subsequent phases. 3.1 Estimating Server Specifications Infrastructure Team Determines appropriate server configurations based on application needs and testing requirements.Provides optimal specifications based on available resources and product scale.Supplies information about physical resources and infrastructure to support testing. 3.2 Establishing the Testing Environment Infrastructure Team Installs and configures virtual machines for performance testing.Adjusts server parameters (CPU, RAM, Disk I/O) to meet testing criteria. QC Team Confirms that the environment is ready for testing based on established criteria. 3.3 Adjusting Parameters According to Testing Requirements Infrastructure Team Modifies server configurations based on optimal parameters suggested after initial tests.Ensures configuration changes do not affect system stability. Step 4: Conducting Tests 4.1 Performing Performance Tests QC Team Executes load tests on APIs and key functionalities.Utilizes testing tools (JMeter, k6, Postman, etc.) to measure performance. Infrastructure Team Supports environment management and monitors system resources during testing. 4.2 Reporting Results QC Team, Infrastructure Team Compiles test results (response times, CPU load, RAM usage, etc.) from various tools.Compares results against established performance targets.Sends detailed reports to stakeholders (PTL, Backend Team). 4.3 Post-Test Optimization Backend Team Analyzes test results and fixes bugs or optimizes source code and application logic. Infrastructure Team Adjusts server configurations or optimizes system resources based on test outcomes. QC Team Re-run tests after optimization to ensure improved performance is achieved.Compiles final test results and confirms with stakeholders. Step 5: Clearing Test Data 5.1 Restoring Server Configuration to Initial State Infrastructure Team Resets server configurations to their original state to reduce unnecessary resource consumption.Deletes or powers down virtual machines used during testing.Ensures no temporary configurations or unnecessary test environments remain in the system. 5.2 Removing All Test Data from Databases QC Team Identifies test data that needs deletion to prevent junk data from affecting the live system. Back End Team Safely deletes test data from the database while ensuring no production data is mistakenly removed.Verifies that the database is clean after deletion. This process of performance testing enables SupremeTech to optimize each stage effectively, ensuring our products achieve optimal performance before delivery to partners. With our experienced workforce, we consistently prioritize product efficiency and quality.

                          10/12/2024

                          842

                          Vu Nguyen Q.

                          Knowledge

                          +0

                            SupremeTech’s Expertise in the Process of Performance Testing

                            10/12/2024

                            842

                            Vu Nguyen Q.

                            Knowledge

                            +0

                              The Importance of Performance Testing and SupremeTech’s Expertise

                              Hello everyone, I’m Vu, a dedicated Quality Control professional committed to delivering software and applications that provide the best user experience. With over 12 years of experience in the industry, I am excited to share valuable insights on Performance Testing—an essential step to ensure that software functions smoothly and effectively before it reaches users. Even a slight delay can lead to customer loss in today's fast-paced era, making performance testing crucial for all businesses. How can systems maintain smooth operation during unexpected traffic spikes? How can we prevent crashes during peak times? The solution lies in performance testing. At SupremeTech, we provide high-quality performance testing solutions that guarantee your systems remain stable and efficient. 6 Notable Technology Incidents From the Past Healthcare.gov (2013): This insurance website crashed completely when it launched, leading to significant confusion among American citizens.Amazon Prime Day (2018): The e-commerce giant lost substantial revenue on the epic sale because the platform had crashed.Google Cloud (2019): A configuration issue caused Google Cloud to crash, affecting numerous primary services and highlighting the importance of performance testing.Zoom During the Covid Pandemic (2020): To meet the surge in online work demand, Zoom had to build its infrastructure rapidly.Facebook Outage (2021): A configuration error caused the entire Meta ecosystem to go down for 6 hours, resulting in significant reputational and financial losses.PlayStation Network (2023): Shortly after launching a new game on PlayStation 5, Sony was unprepared for gamers' inability to download it. These incidents serve as a wake-up call for all businesses. No system is immune to performance issues if it hasn't been thoroughly tested and optimized. Here are some key reasons why companies should prioritize Performance Testing for their products: Prevent Revenue Loss: A slow or crashing system can drive customers away, leading to lost revenue.Protect Brand Reputation: Major performance incidents often leave a negative impression, damaging credibility.Prepare for Growth: Testing allows you to scale operations confidently without worrying about system issues. What is Performance Testing? Performance testing is a method of testing, measuring, and evaluating a system's speed, stability, and load capacity to ensure it operates effectively under various conditions. Overview of Performance Testing: Load Capacity Assessment: Determining the maximum load limit that the system can handle.Identifying Bottlenecks: Finding weaknesses as a way to enhance performance.Improving User Experience: Ensuring users have a smooth experience while protecting brand reputation. Types of Performance Testing Load Testing: Evaluating load capacity by simulating large numbers of concurrent users. We identify the system's load threshold and address weaknesses before issues arise.Stress Testing: Pushing the system to its maximum limits to test its response in worst-case scenarios, ensuring safety.Endurance Testing: Assessing system durability when operating continuously over long periods to ensure stable performance.Spike Testing: Simulating sudden spikes in traffic, such as during major sales campaigns, helping businesses prepare for peak hours. SupremeTech's Exceptional Capabilities Flexible Integration with Various Platforms: We can conduct tests across diverse platforms, from mobile applications and websites to complex systems, ensuring optimal performance for all platforms.Detailed Data Analysis: We not only identify bugs but also provide detailed reports with optimization recommendations based on real data.  This helps you effectively address performance issues.Flexible Automated Updates: SupremeTech's automated systems allow businesses to adjust and optimize their processes easily as they grow.Dedicated Consulting Team: SupremeTech's experienced experts are ready to support you from planning through implementation and maintain high efficiency. SupremeTech - Your Partner for Optimal Performance At SupremeTech, we are committed to researching advanced technologies, maintaining professional workflows, and employing a passionate team to deliver exceptional value in all our products and services. Performance testing is more than just a technical task; it is essential for maintaining your reputation and achieving market success. Allow SupremeTech to enhance your products for today and the future. For more insights into Performance Testing, check out our blogs below: The Process of Performance Testing at SupremeTechThe Ultimate Guide to an Essential JMeter Performance Testing ToolPerform API Testing using Postman

                              10/12/2024

                              763

                              Vu Nguyen Q.

                              Knowledge

                              +0

                                The Importance of Performance Testing and SupremeTech’s Expertise

                                10/12/2024

                                763

                                Vu Nguyen Q.

                                Knowledge

                                Software Development

                                +0

                                  How to Undo Commits Safely in Git: Git Reset and Git Revert Explained

                                  Introduction In software development, mistakes in commits happen more frequently than we would prefer. Imagine you are working on a feature branch and accidentally commit sensitive information, like an API key, or commit in the wrong branch. You quickly realize the need to undo these changes, but as you search for solutions, you come across two common commands: git reset and git revert. Each offers a way to return, but which is right for your situation? In this article, SupremeTech will explore both commands, how they work, when to use them, and how to decide which approach best addresses your specific needs. Three trees in Git Before getting started, it’s important to understand Git's internal state management systems, called “Git’s three-tree”: Working Directory: This is the workspace on your local machine, it reflects the current state of your files and any changes made that have not yet been staged or committed. You can see changes in the Working Directory with git status.Staging Index: This space holds a snapshot of changes ready to be committed. After you’ve made changes in the Working Directory, you can add them to the Staging Index with git add.Commit History: This is the timeline of saved changes in your project. When you use the git commit command, it takes the changes from the Staging Index and adds them to this history as a new commit. Figure 1. The Git’s three-tree The animation above demonstrates Git's three-tree structure by showing the creation of file1.js and committing it as C1. We add two more examples: file2.js as a C2 commit and file3.js as a C3 commit. These three commits will be used throughout the article as we explore git reset and git revert commands. Figure 2. Visualizing Git's three-tree with three commits Undoing commits with git reset The git reset command allows you to undo changes in your working directory by moving the branch tip back to a specific commit and discarding all commits made after that point. Figure 3. Visualizing the git reset command After running the command git reset HEAD~1, you’ll notice two changes: The branch tip has moved to the commit C2.The latest commit (C3) has been discarded from the commit history. The HEAD~1 is a way to reference the commit before the current HEAD. You can use similar syntax to go back further, like HEAD~2 to go back two commits from HEAD. Alternatively, you can specify a particular commit using its hash ID. The next question is where did the changes from C3 commit go? (the file3.js in this example). Did it delete permanently, or is it saved somewhere? This is where the git reset flags come into play. Bypassing one of the following flags, you can control the changes: --soft: It undoes the commits in the history and places the changes back in the Staging Index, ready to be committed again if needed. Figure 4. Visualizing git reset command with --soft flag -—mixed (this is the default option): It is similar to—-soft but also clears the Staging Index. This means any changes from the discarded commits are left unstaged in the Working Directory, requiring you to re-add them before re-committing. Figure 5. Visualizing git reset command with --mixed flag --hard: This option clears all changes from both the Staging Index and Working Directory and resets the codebase to match the specified commit without making any modifications. Figure 6. Visualizing git reset command with --hard flag By using git reset, you've successfully undone a specific commit. However, try to push these changes to the remote repository with a regular git push. You’ll get an error because the local commit history no longer matches the remote. To push these changes, you need to use a force push (git push --force). While this command will update the remote branch, it comes with risks - it can overwrite the remote history, creating potential issues for other developers. To avoid these problems, let’s explore a safer alternative: Undoing public commits with git revert The git revert command is an undo command, but it doesn’t work like the git reset. Instead of removing a commit from the project history, it creates a new one containing the inverse of the original changes. Figure 7. Visualizing the git revert command The result of running the command git revert HEAD is a new commit that undoes the changes made in the C3 commit. Since the C3 commit added file3.js, the revert will effectively delete this file. In short, running git revert HEAD will bring your code back to its state at the C2 commit. You can prevent git revert from automatically creating a new commit by using the -n or --no-commit flag. With this option, the inverse changes are placed in the Staging Index and Working Directory, allowing you to review or modify them before committing. Figure 8. Visualizing git revert command with --no-commit flag The git revert command allows you to go back to previous commits without removing any mistake commits. It doesn’t re-write the project history. Because of this, this command should be used to undo changes on a public branch. What is the difference between Git Reset vs. Git Revert? The difference between git reset and git revert is that git reset should be used to undo changes in your local history, while git revert should be recommended for undoing changes on a shared or public branch. Both git reset and git revert are commands for undoing changes, but they work differently in key ways: git resetgit revertHow it worksReverts to a previous state by removing the specified commit.Reverts to a previous state by creating a new commit with inverse changes.OptionsOffers --mixed, --soft, and --hard flags to control how changes are handled.Offers --no-commit to add inverse changes without automatically committing them.UsageRecommended for undoing changes in your local history.Recommended for undoing changes on a shared or public branch. Conclusion By now, you should clearly understand how to undo changes in a Git repository using git reset and git revert. In short, use git reset for local-only history changes, and use git revert to undo changes on a shared branch safely. Choosing the right command for your situation lets you keep your project history clean and ensures smoother collaboration with your teammates.

                                  25/11/2024

                                  1.08k

                                  Huy Nguyen K.

                                  Knowledge

                                  +1

                                  • Software Development

                                  How to Undo Commits Safely in Git: Git Reset and Git Revert Explained

                                  25/11/2024

                                  1.08k

                                  Huy Nguyen K.

                                  Customize software background

                                  Want to customize a software for your business?

                                  Meet with us! Schedule a meeting with us!